 LIVE CHAT
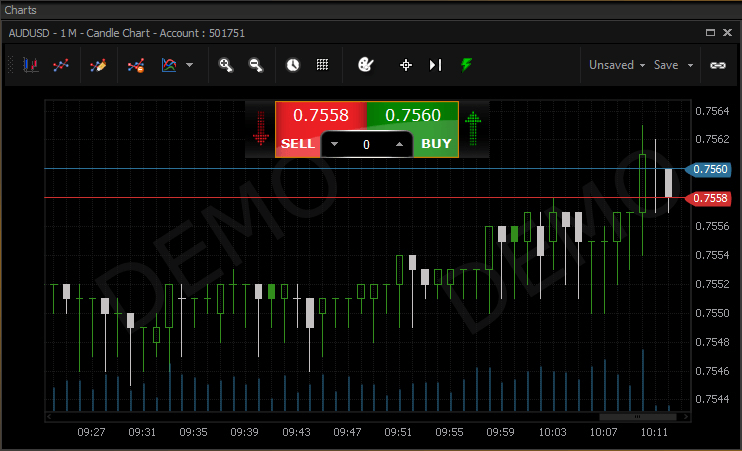
The chart panel allows you to present the complex data visually, as easy-to-understand live market movements. The charts enable you to view the market history data, analyze the market pattern, and make well-informed decisions. The study and the analysis of the historic price data helps to anticipate the future movements in the price of a symbol.
The panel comprises the following options
A chart displays the toolbar at the top of the panel. It can be the Main Menu bar or Line Studies bar.
The Quick Trade is the fastest way to perform the trade.
The Cross Hair helps to find the price at a specific point in the chart.
Scrollbar helps to view more data on a small arena in the panel. By scrolling or dragging you can navigate your chart history.
You can scroll up or down for zoom in or zoom out. The zoom in and zoom out buttons are available in the toolbar.
You can choose two themes for the chart (Black and White).
It lists the menu with predefined Technical Indicators.
It helps to add one graph of the symbol on the other so as to observe symbol correlations.
The customized charts can be saved as a template. Moreover, the same template can be used in all the other panels in the same group.
Activate the panel link help to synchronize all other panels to that symbol.
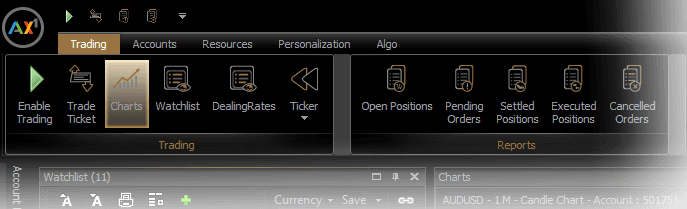
From Ribbon Menu, select Trading > Charts option.
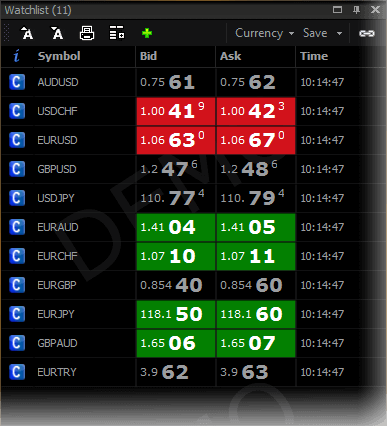
From the Watchlist, click the chart column or right-click and select the chart option for the respective symbol.
In the chart panel, you can change the symbol in two ways.
Drag the symbol from the Watchlist and then drop it into the chart area of the panel.
After linking the chart panel with the Watchlist, you can change the symbol of the chart. For further information about this, please refer to Links.
Even after you change the symbol the indicators and overlays still in place and line studies are cleared on change.
In the chart panel, right click on any area where you will get a dropdown pop-up with the listed options.
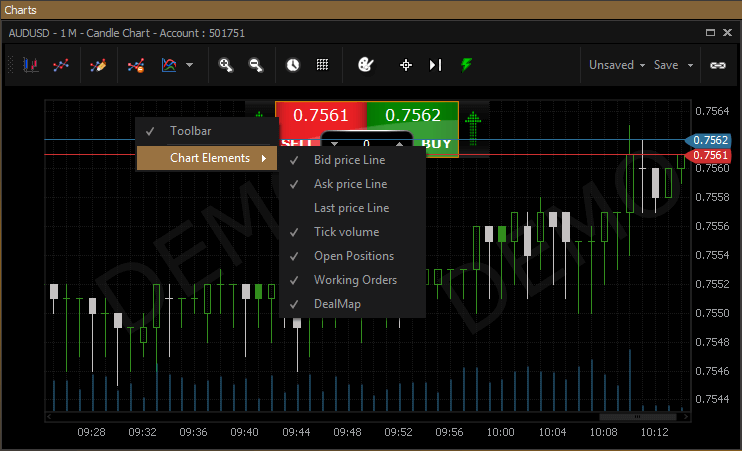
Click to show / hide the toolbar in this panel.
Click and select the required price line in the pop-up. It can be bid price, ask price and the last price. Then, you can show/hide the tick volume on the chart.